Every critical system, live in one browser console.
The Pythia DM monitors the power, cooling and environmental equipment that keeps your site running, in one browser console with alarms, trends and live equipment dashboards. It shares that data with your BMS and NMS, and with the AI assistants your team already uses.
One platform for the equipment that keeps your site running.
UPS systems, generators, power distribution, cooling, leak and environmental sensors, servers and switches usually report to separate screens, if at all. The DM polls each one in its own protocol, shows all of it live in one console, and tells the right people when something needs attention.
Connect
Each piece of equipment is polled by a driver for its make and model. No equipment is replaced.
Organize
Every point lands in one structure (Locations, Groups and Units) with the same alarms, trends and units of measure.
Operate
Facilities and IT work from one browser console and a full-screen Alarm View. Nothing to install on any PC, tablet or phone.
Extend
The same points are published to your BMS or NMS automatically. Add the AI Connector when you're ready.
Live monitoring with status roll-up
A unit in alarm turns its group, location and the site tree red, so a problem anywhere is visible everywhere. Disabled items are greyed out and raise no alarms.
Alarms you can act on
Alarm settings per unit, with a fail count so a single bad reading doesn't raise an alarm. Alarms can be acknowledged and cleared, and every occurrence is kept in history. The Alarm View drives a wall display.
Notifications by category
Email and SNMP traps are routed by alarm category, with quiet-time exceptions. Heartbeat messages confirm the DM is alive, so silence is never mistaken for "all normal".
Equipment dashboards
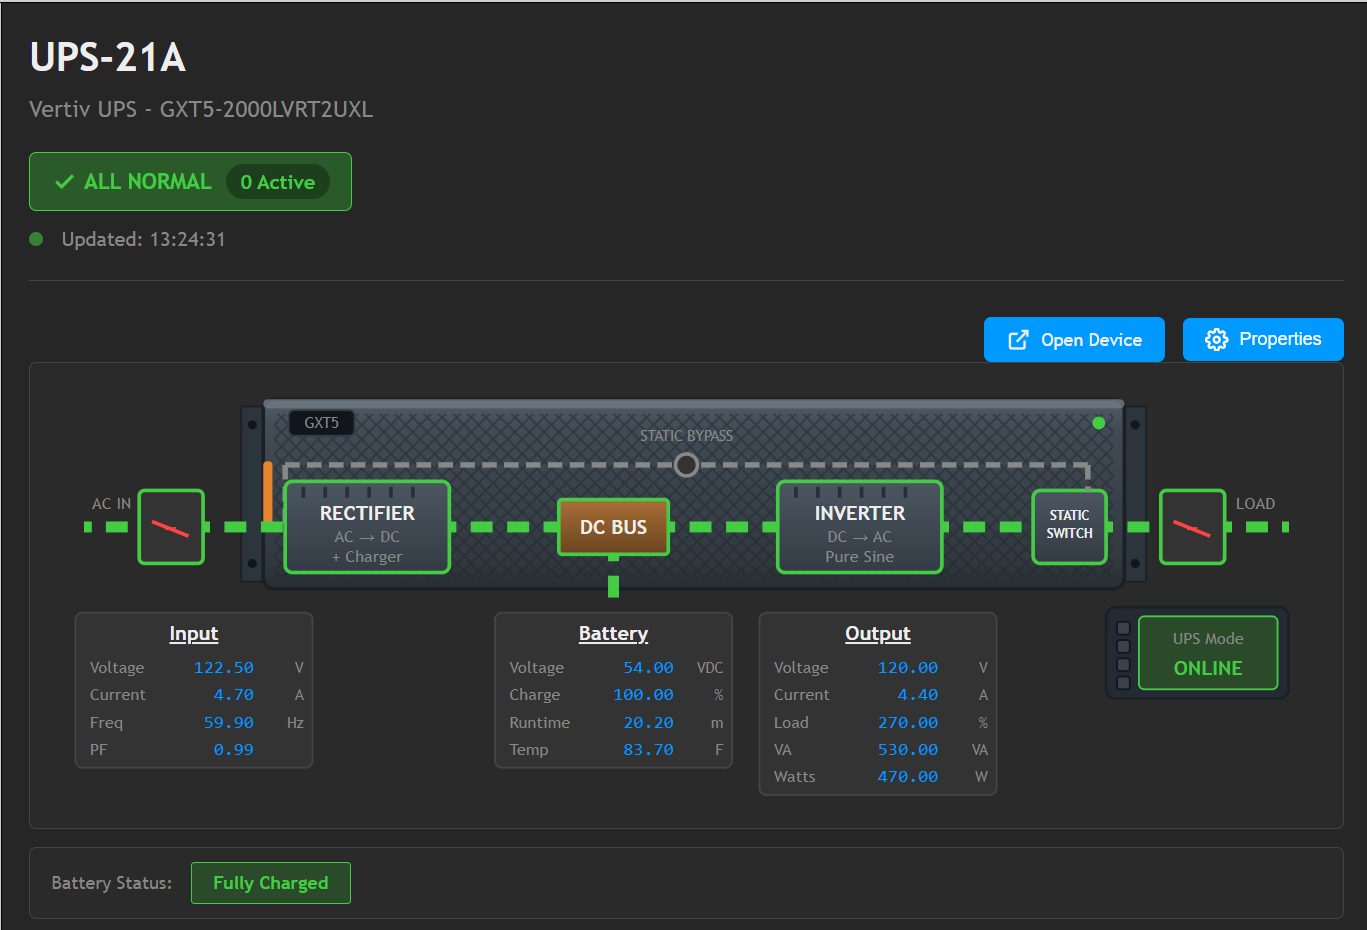
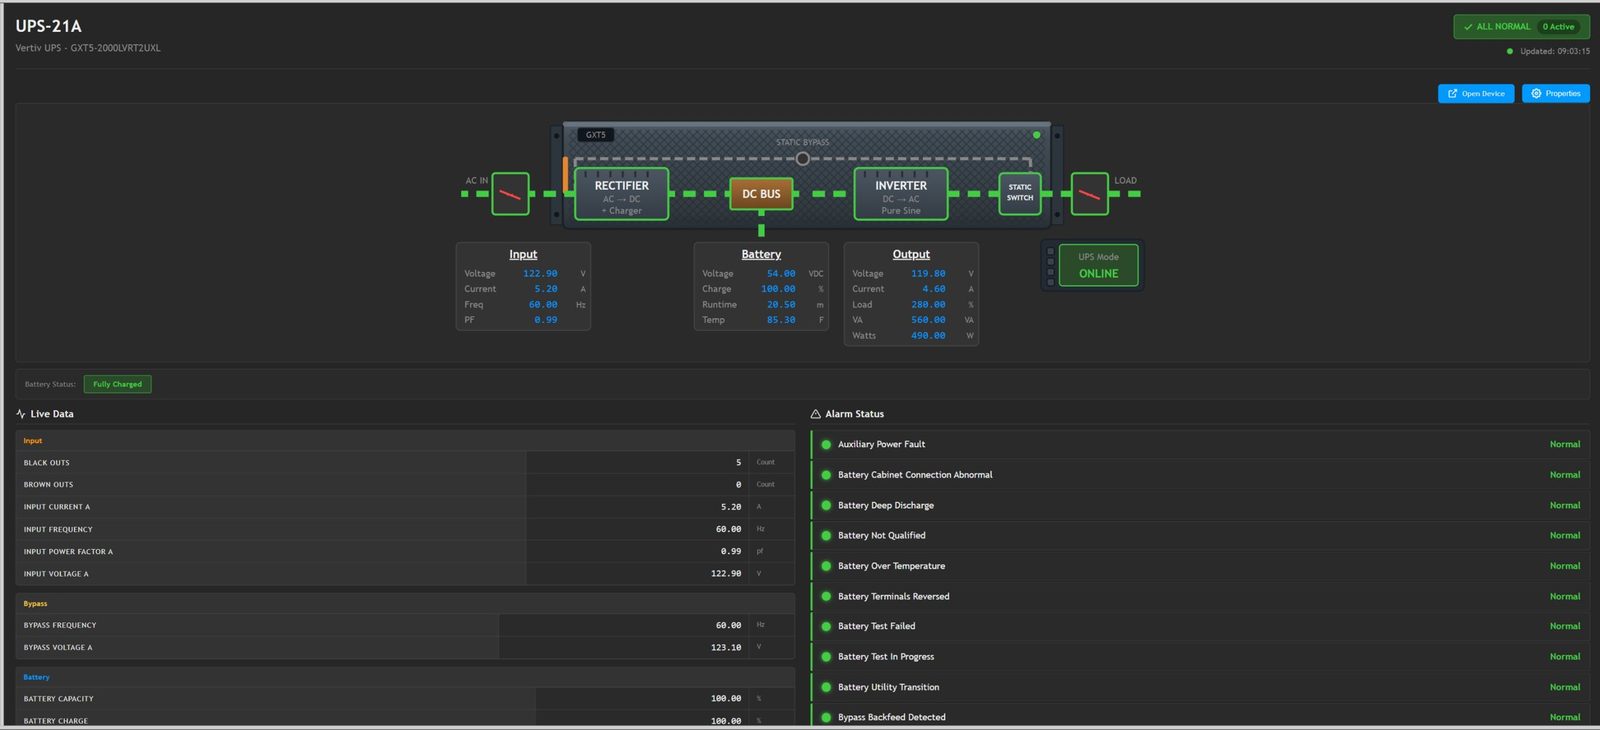
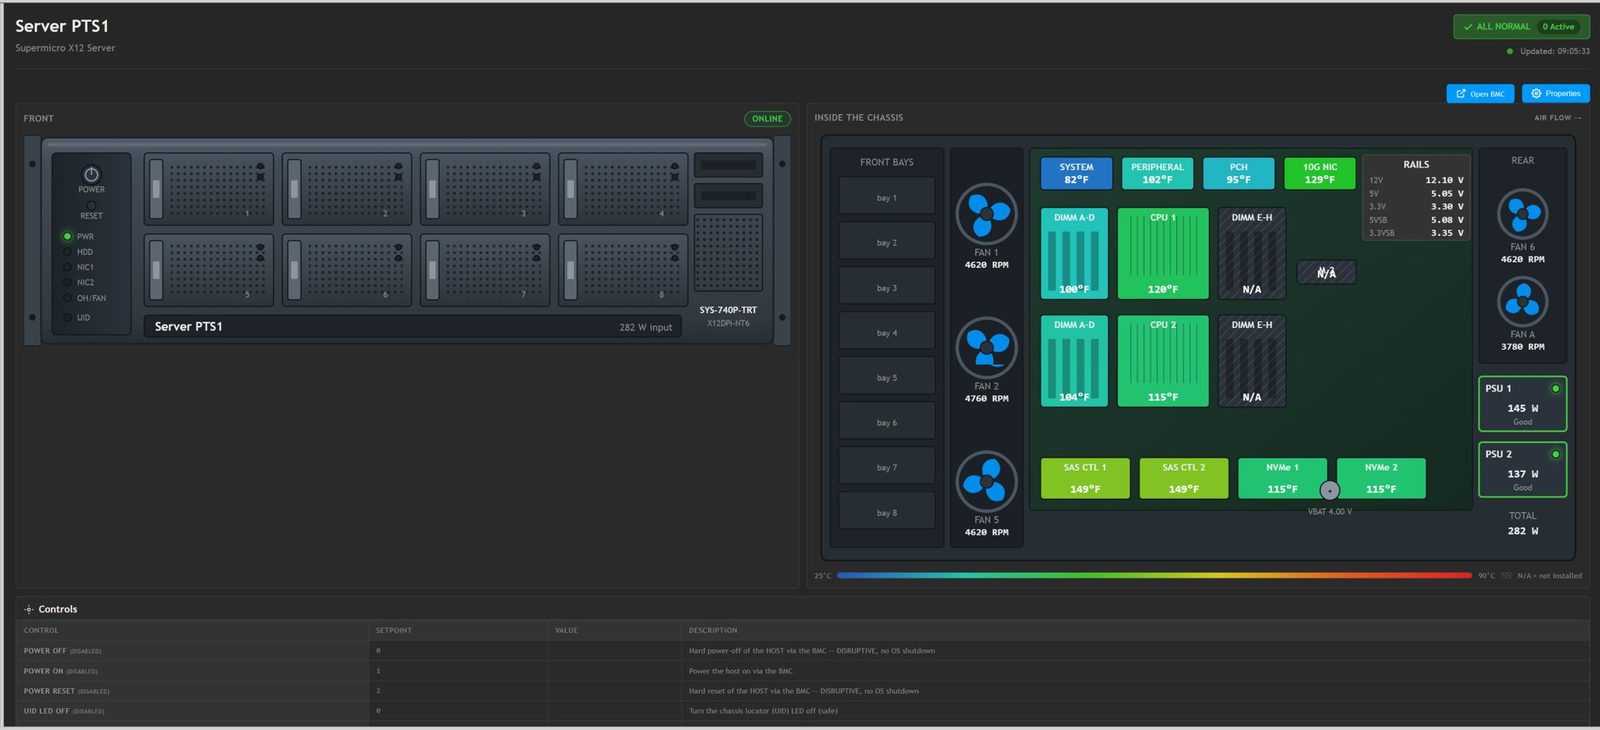
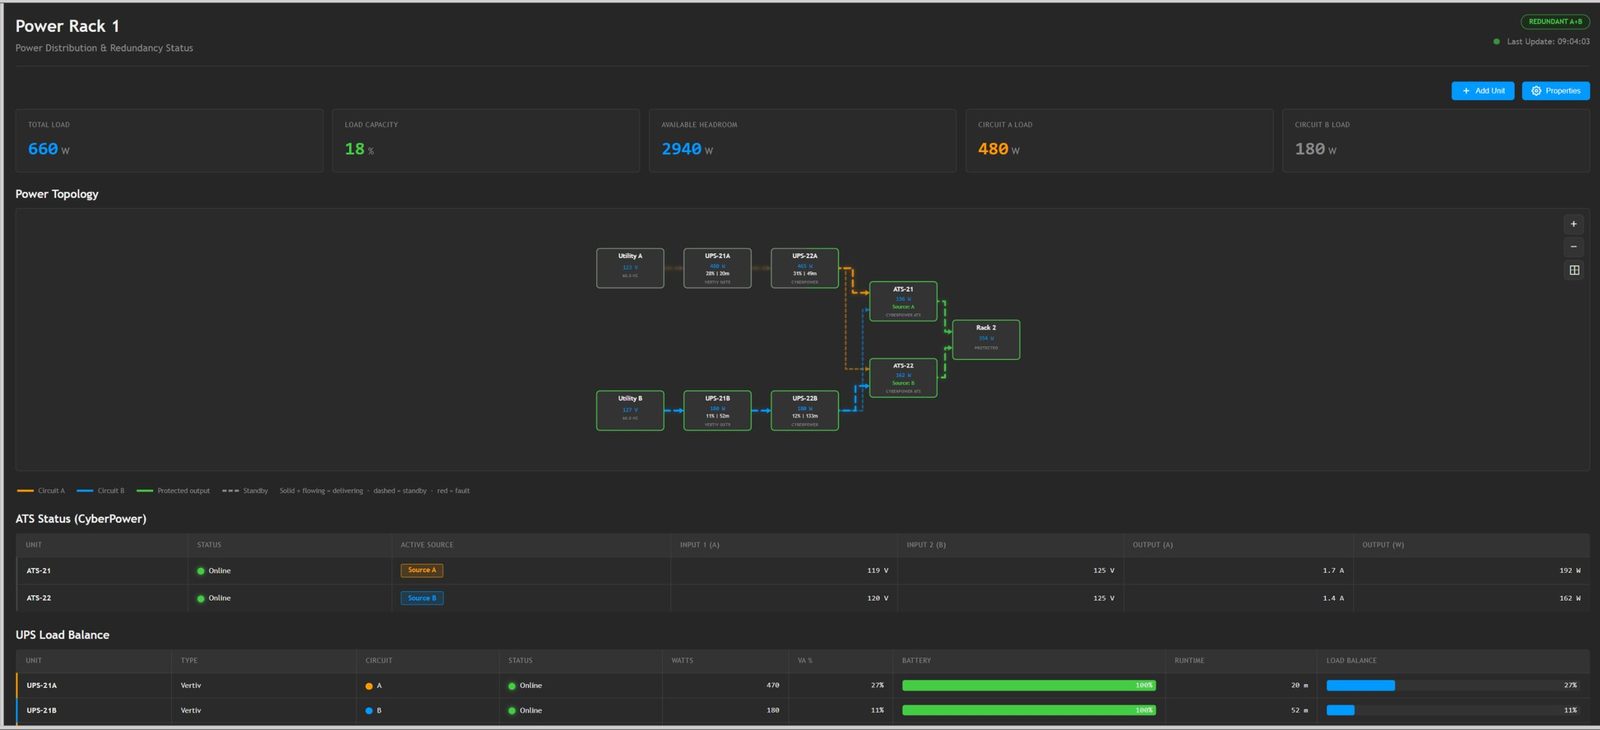
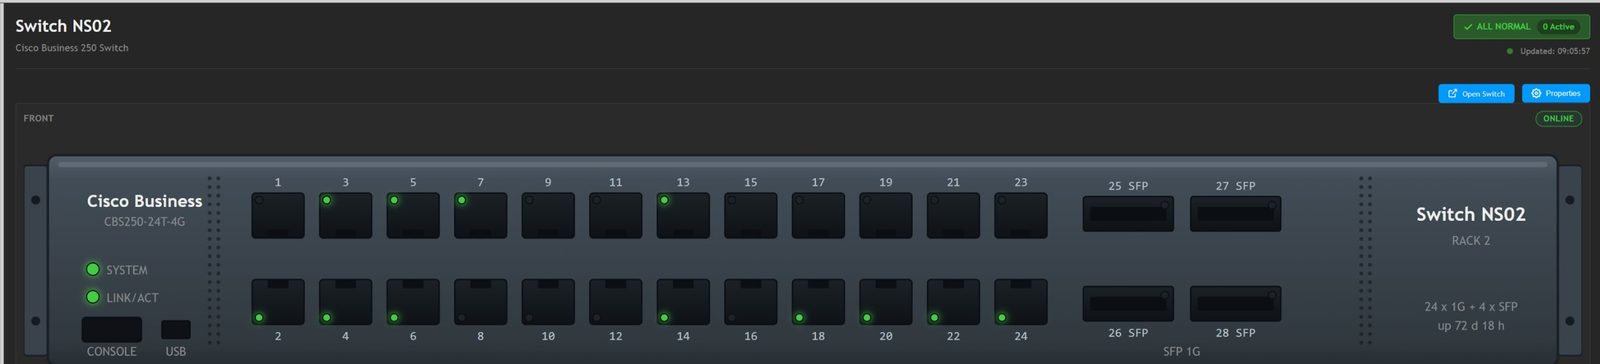
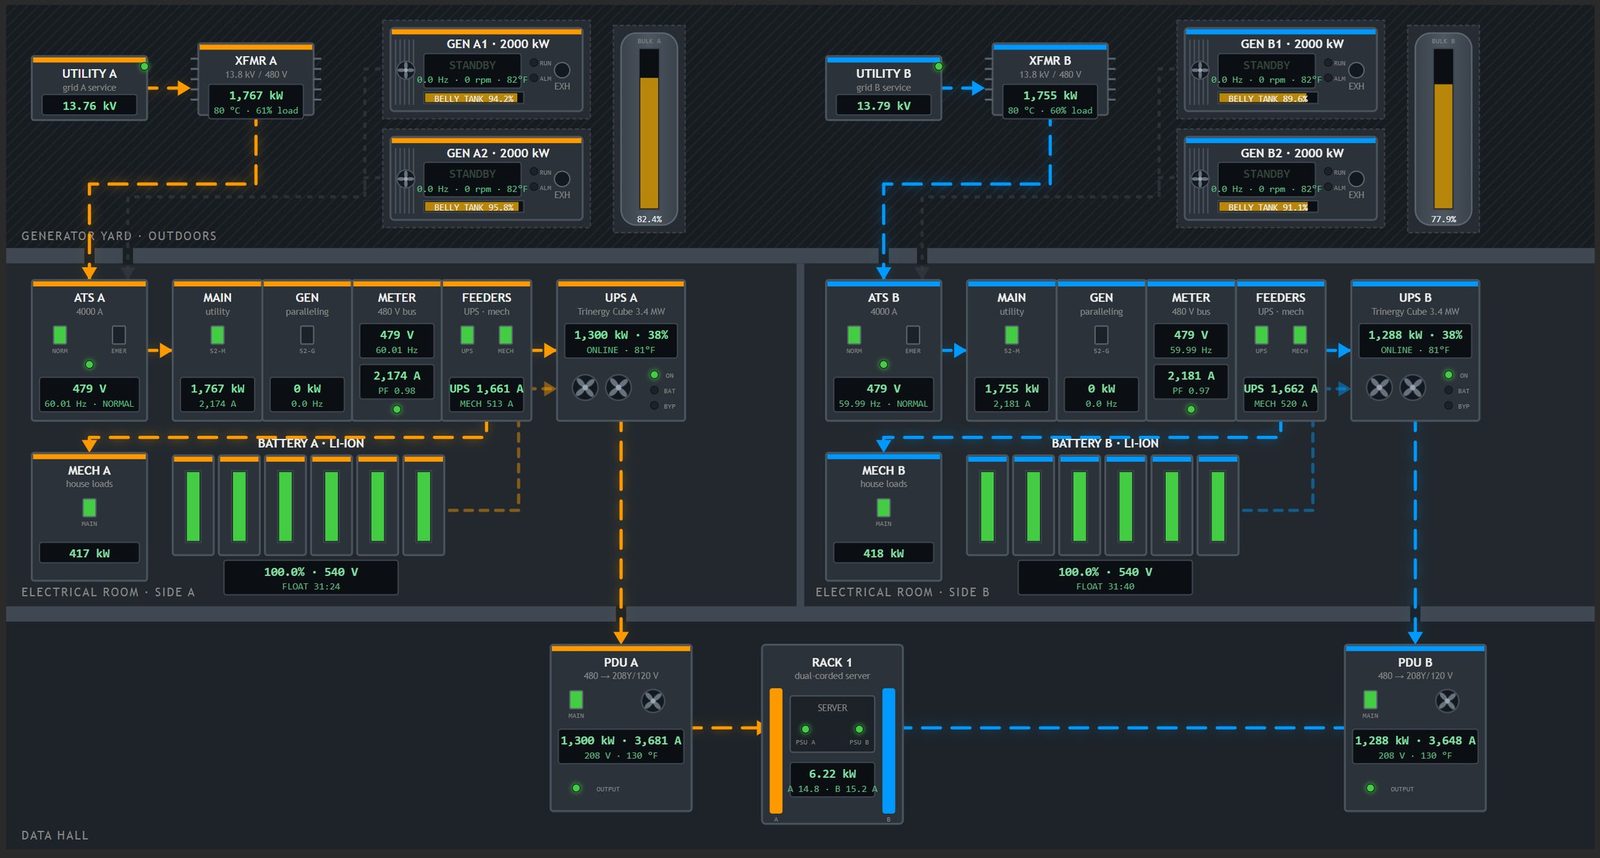
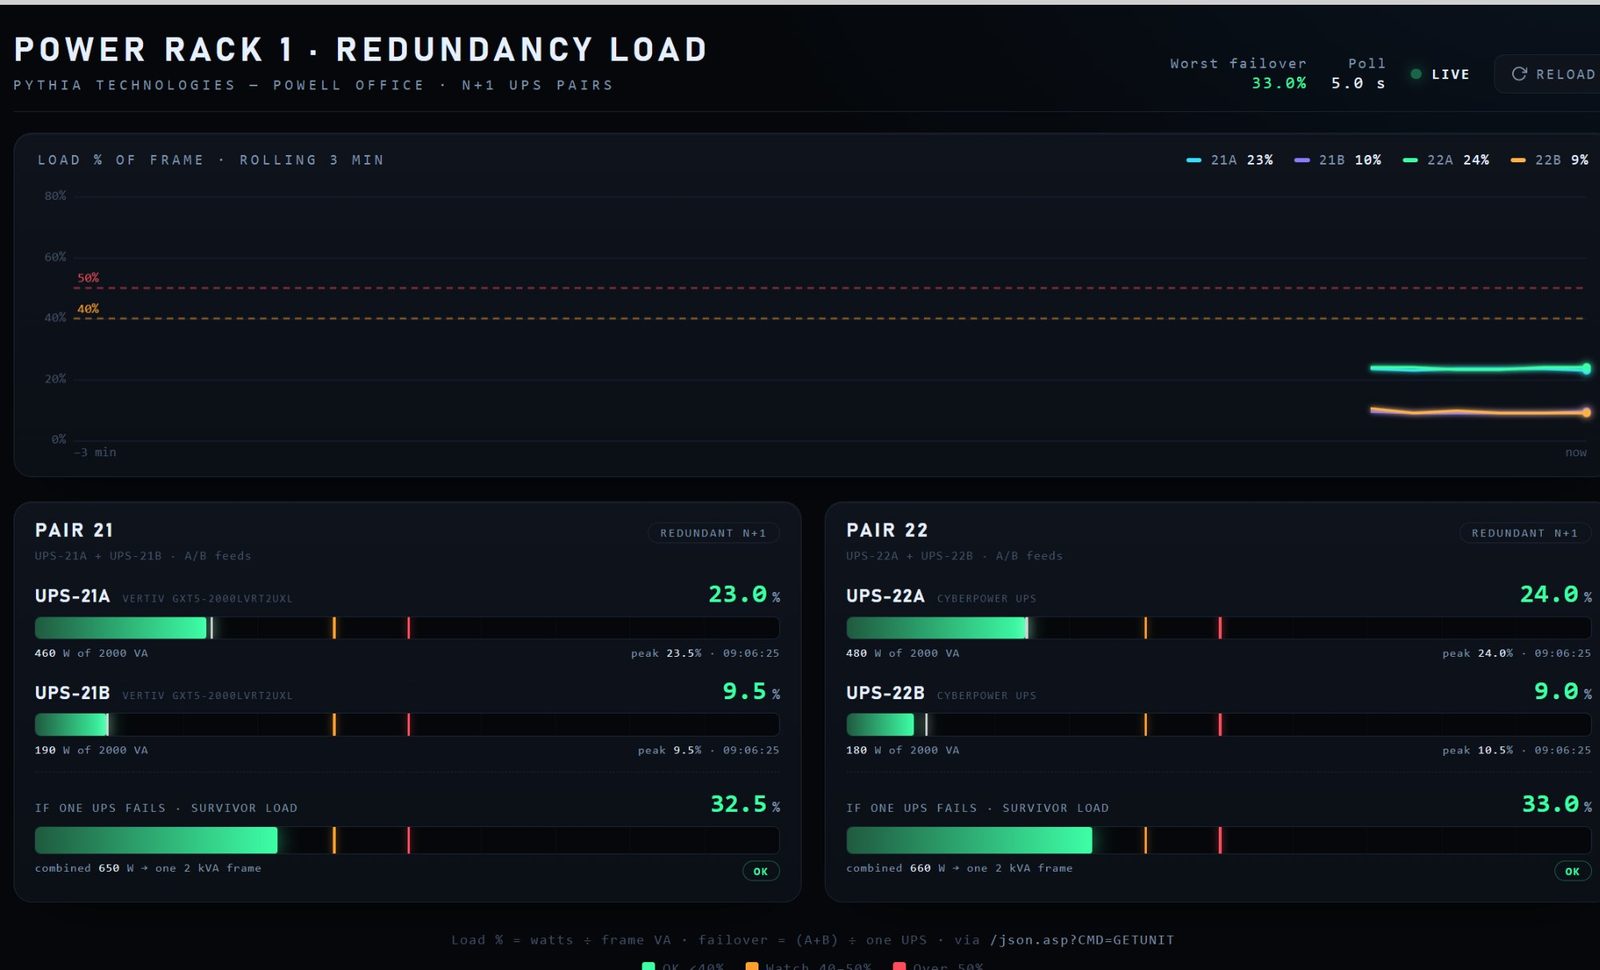
Live diagrams for supported UPS, cooling, power, generator, server and switch models, showing power paths, operating mode, faults and loss of communication.
Trends and history
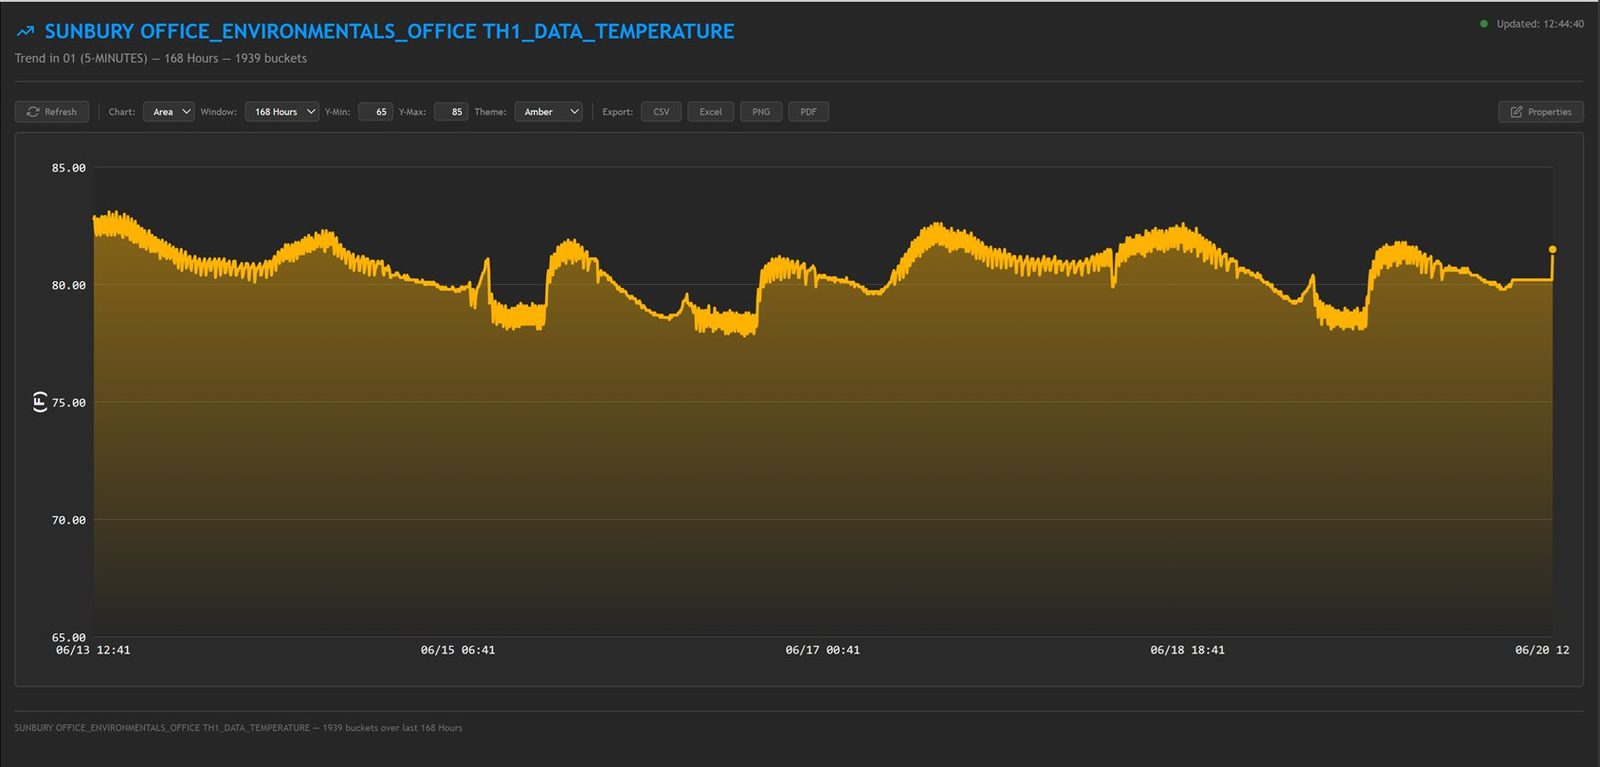
Five trend buckets, from five-minute to long-term, with zoomable charts. Any list, alarm set or point map can be exported to PDF or Excel on demand.
Publishes to your other systems
Everything the DM monitors is published at once as an SNMP agent, a Modbus/TCP server and a BACnet/IP device. The maps are built and kept current automatically.
Custom pages for your building
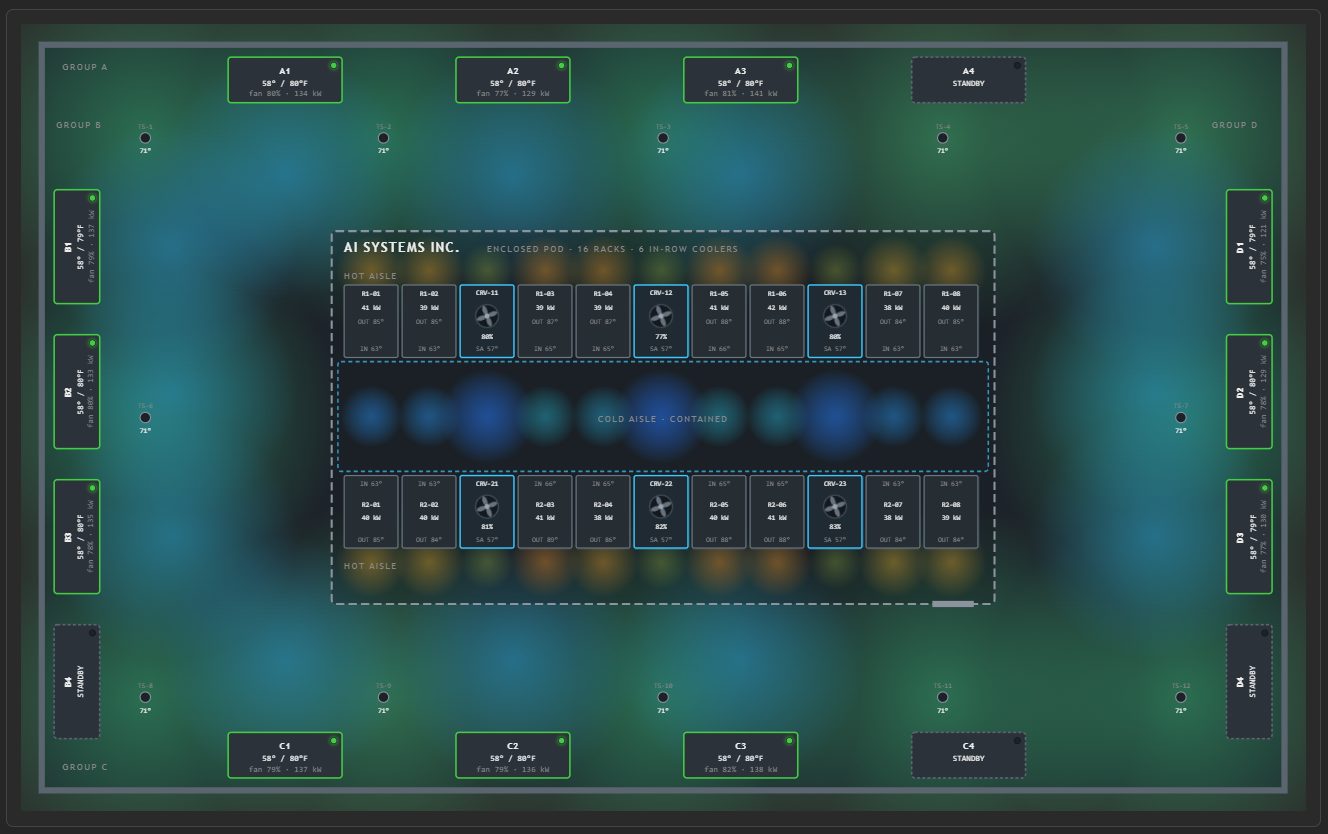
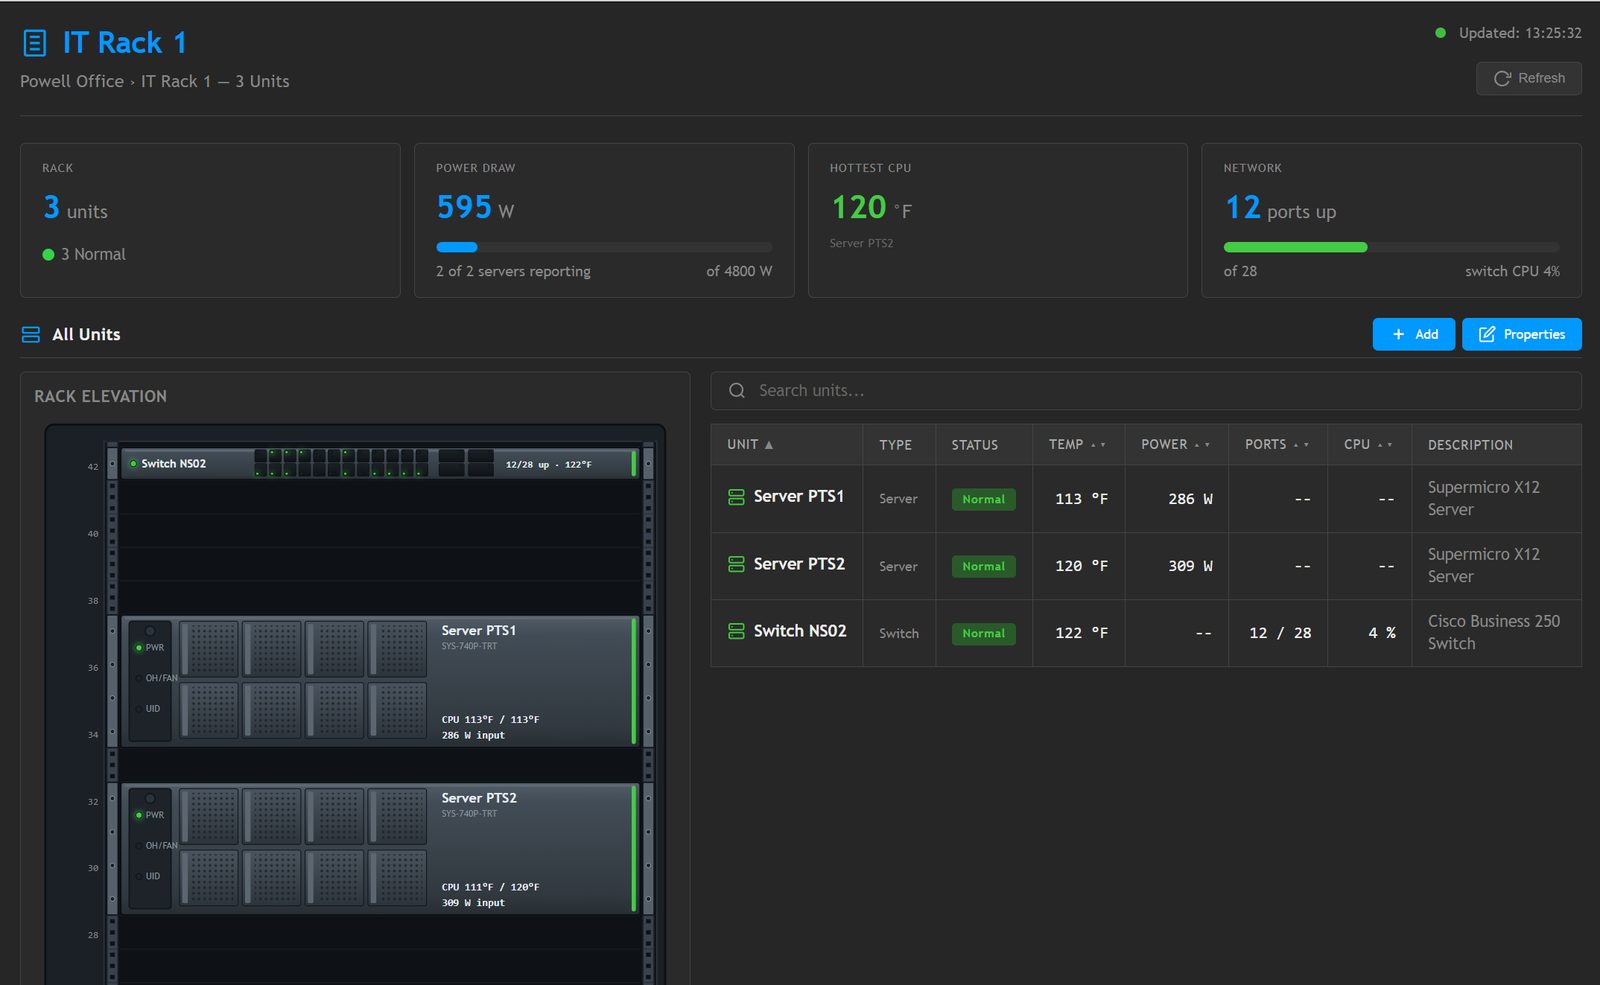
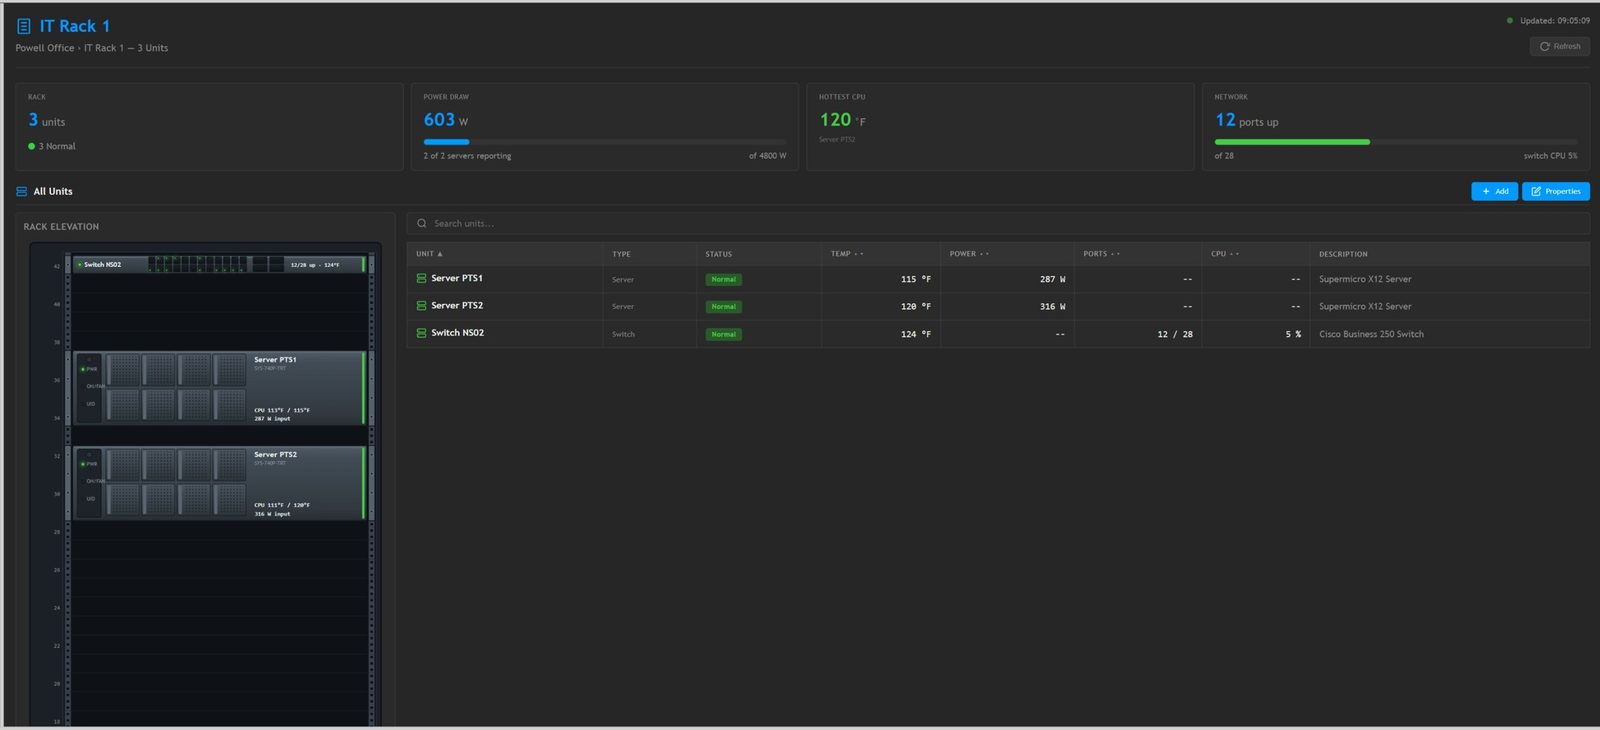
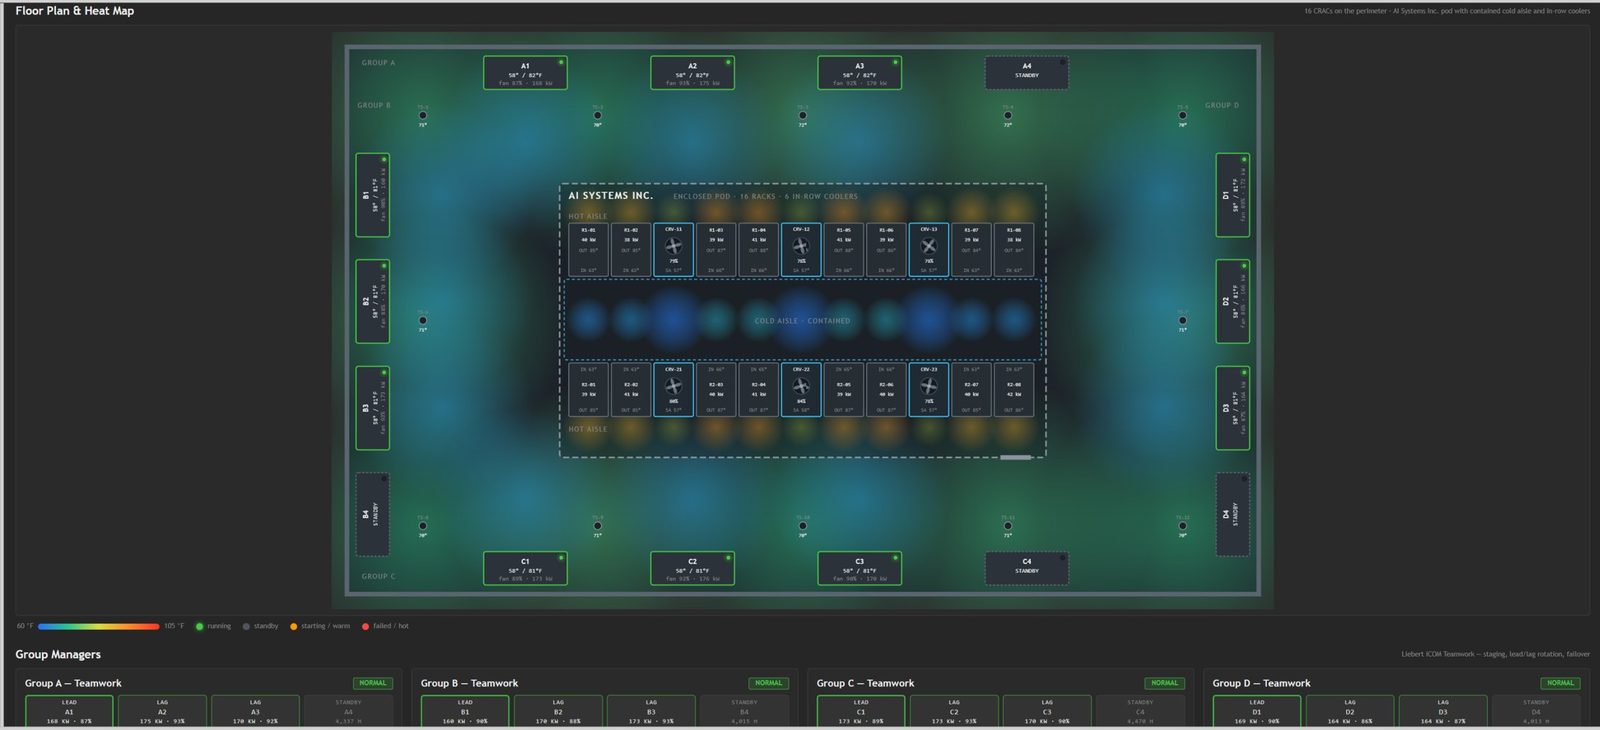
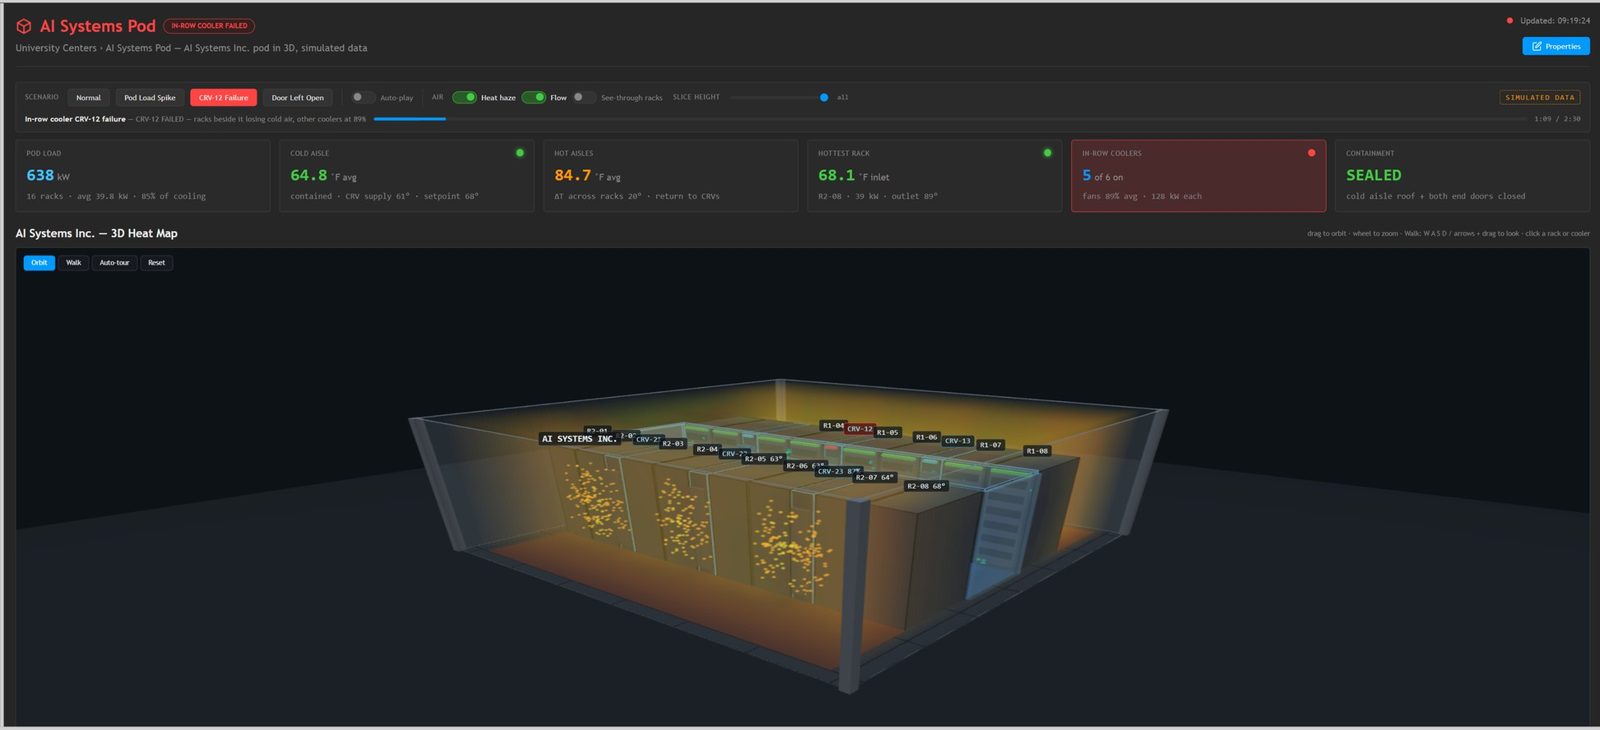
Floor plans with live conditions, heat maps, one-line diagrams and rack elevations, attached to any location or group in the console.
Many sites, one console
A head-end DM consolidates many site DMs into one view, and DMs can also be arranged peer to peer. Admin and View accounts, HTTPS throughout, and updates supplied by Pythia and applied from the console.
Ask your site anything.
Connect Claude, ChatGPT or any assistant that speaks MCP. It answers from the DM's live data: what's in alarm, what changed and how a load trended last week. It can make changes only where you allow it.
How the AI Connector worksEquipment dashboards that look like the equipment.
Supported equipment opens a live dashboard as soon as it's added: power paths that follow the real flow, the unit's own operating mode, fault highlighting, and a clear state when the equipment stops answering. Every point opens a live chart.
Your building, live, the way your team thinks about it.
Custom pages place live readings on a picture of your facility: floor plans, heat maps, one-line diagrams and mechanical schematics. Pythia builds them to order from drawings you supply. They're served by the DM itself and need nothing from the internet.
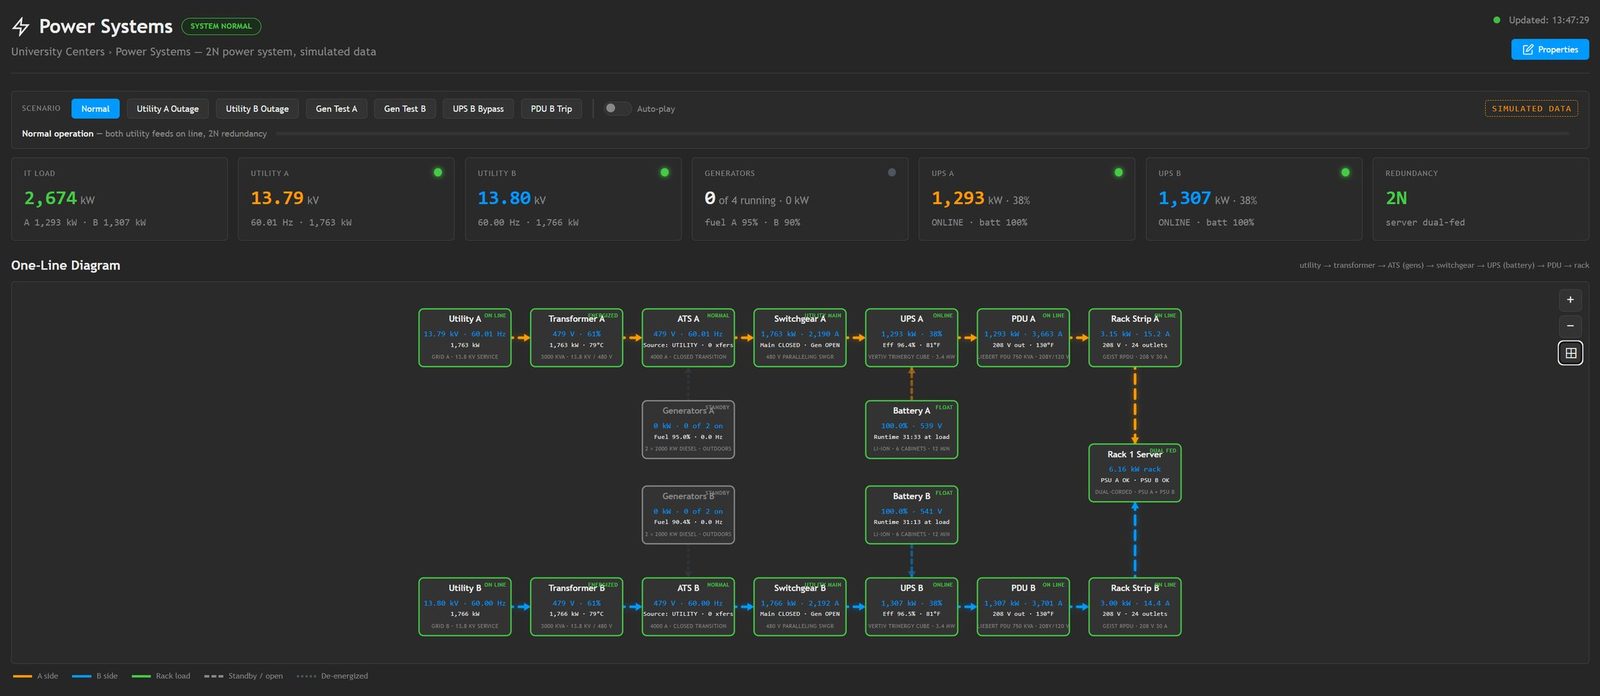
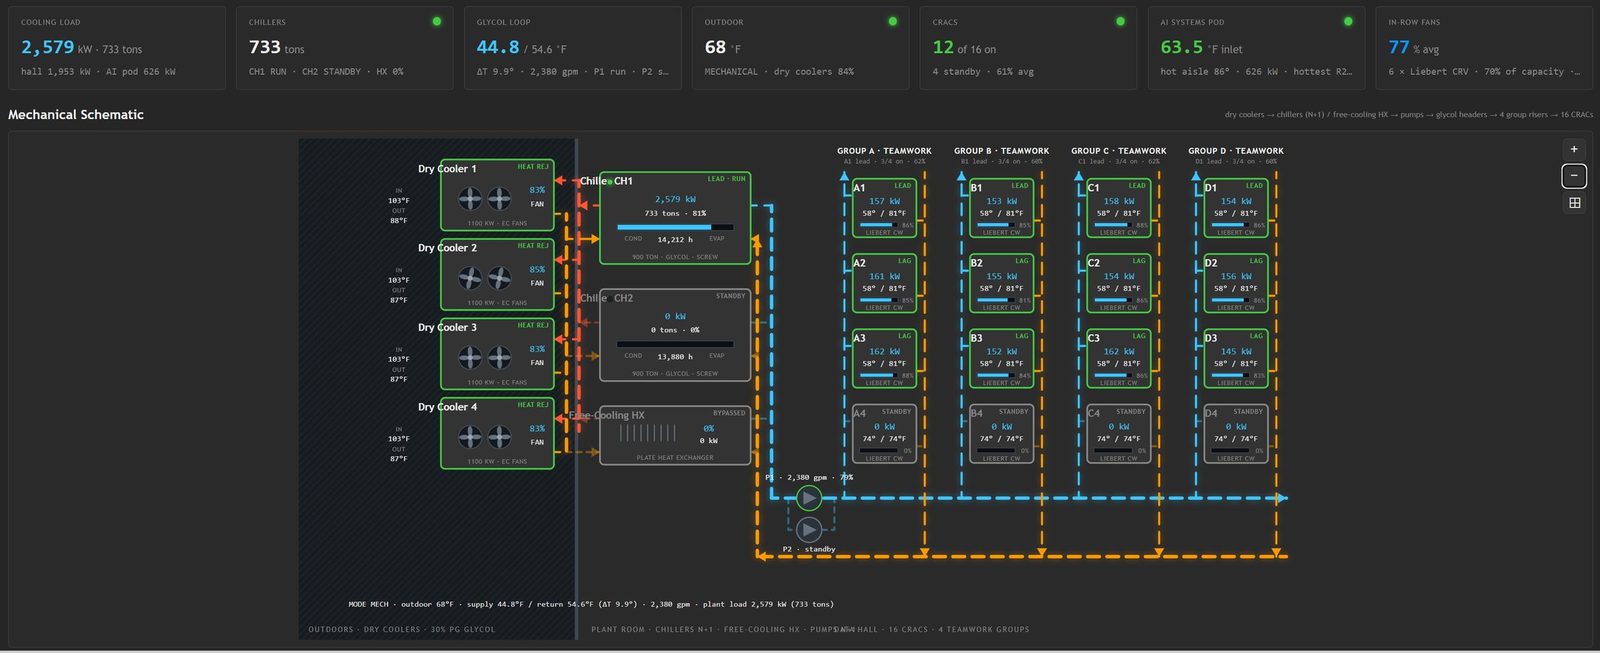
One DM, four ways to run it.
The DM software is the same everywhere. Choose the platform that suits the space and the level of resilience the site needs. The DM is delivered preconfigured, on Pythia hardware or as a dedicated cloud VM.
DM Server
A 1U rack server for the data center or equipment room. Standard (MSS) or Enterprise (MSE).
Redundant pair
Two servers and a dedicated switch. The DM is replicated to a standby server that can take over.
Smart Panels
The same DM in a wall-mount enclosure: SPDM with onboard inputs, SPIGM for Liebert IGM equipment.
DM Cloud
A dedicated VM identical to a purchased server, hosted by Pythia in Microsoft Azure.
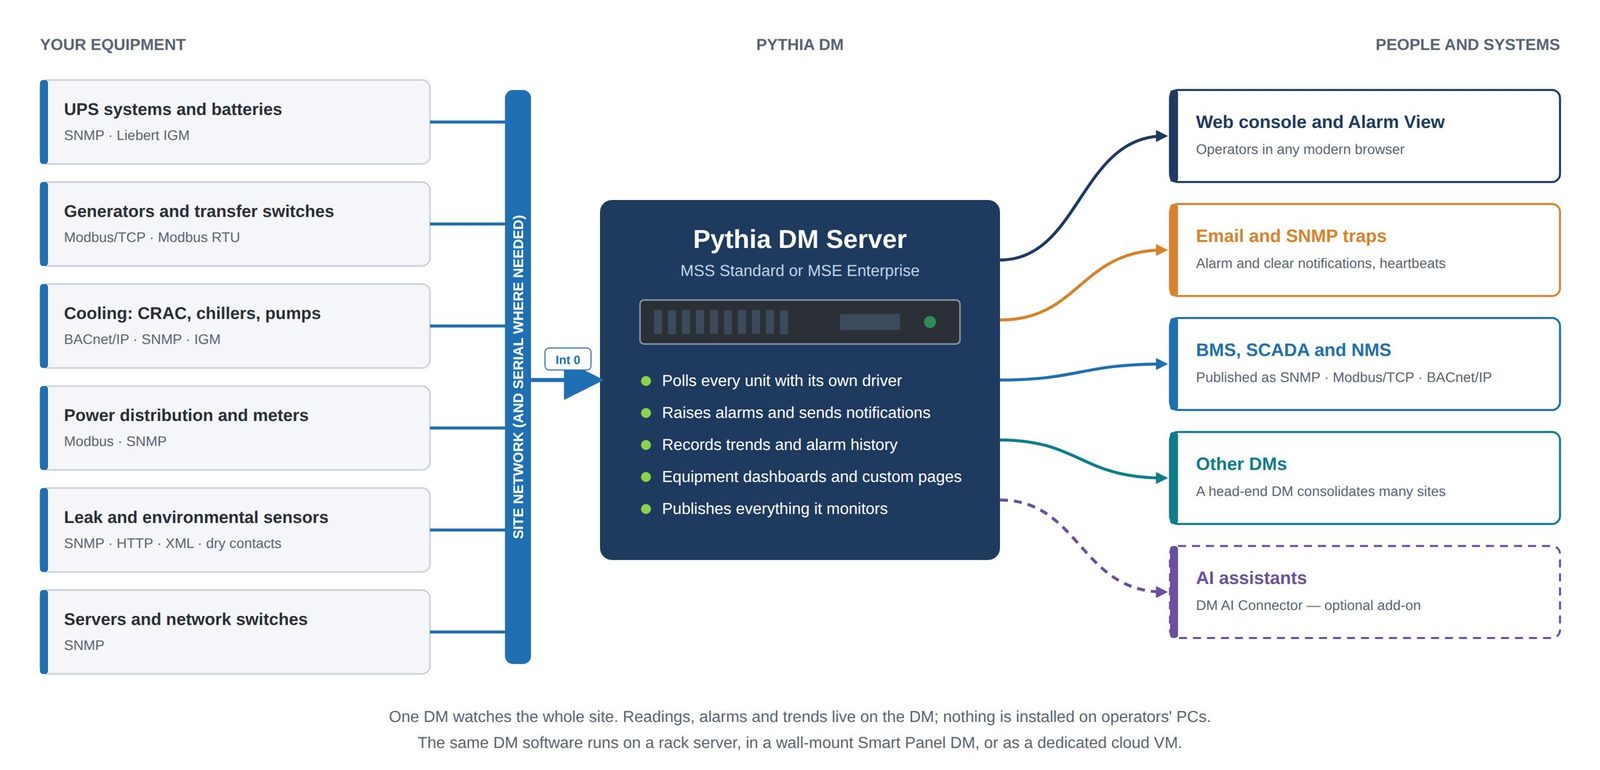
A typical single-server site
Equipment reaches the DM over the site network, or over serial where older equipment needs it. People and systems reach the DM's data through the console, notifications and standard protocols.
When monitoring can't stop: the redundant pair.
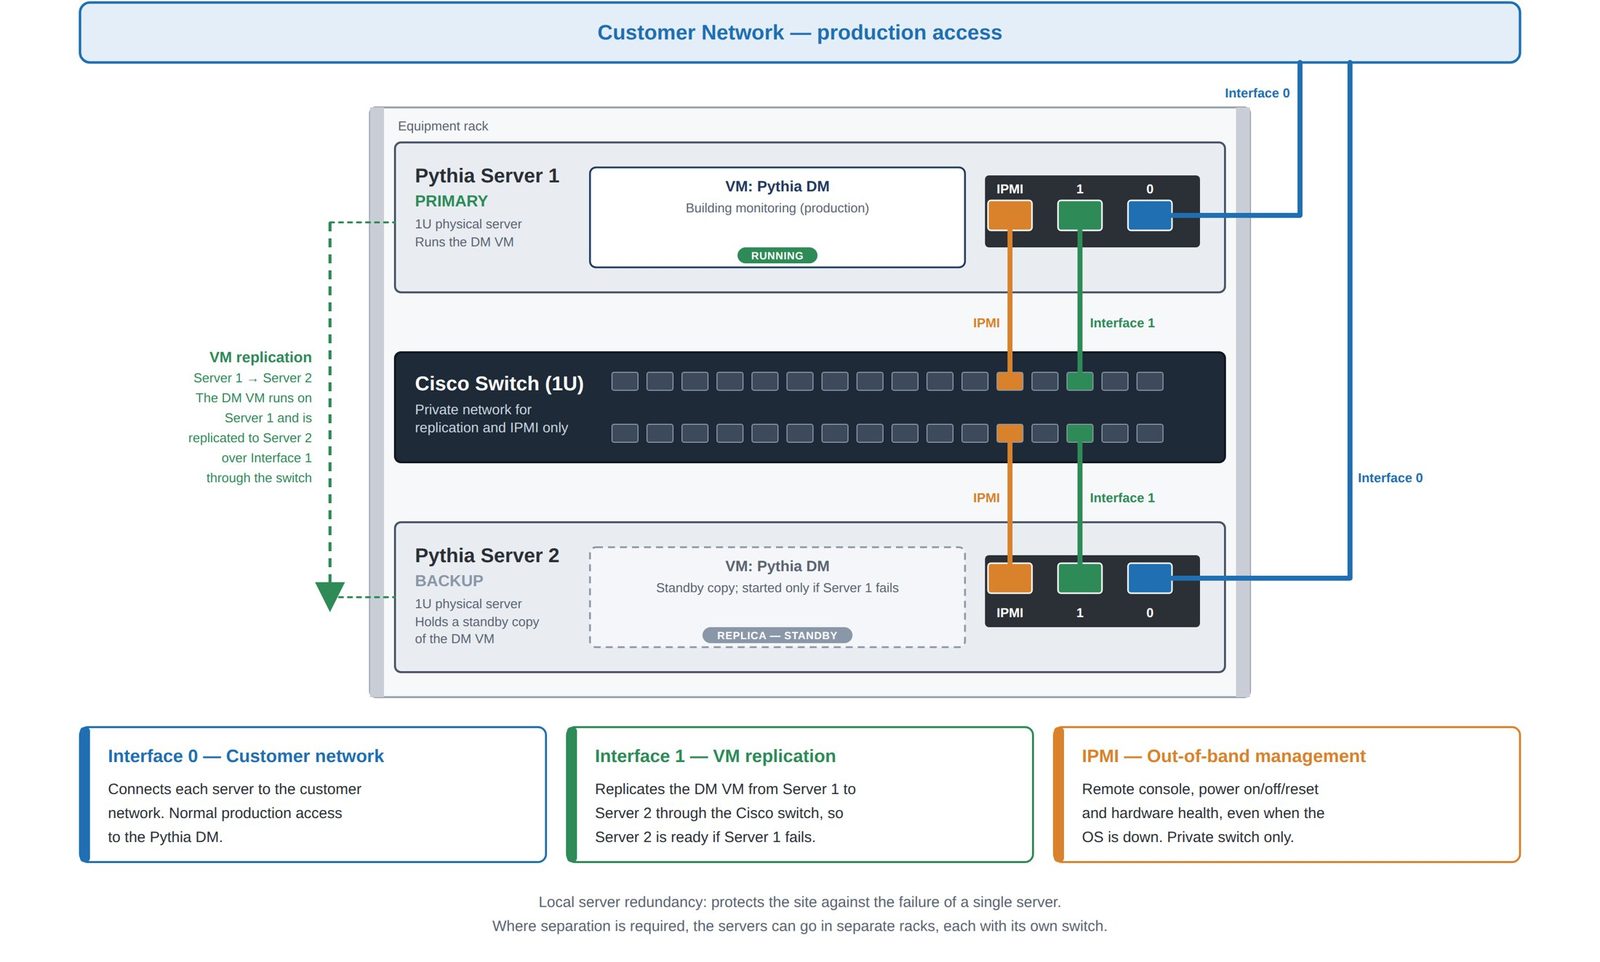
A second server keeps monitoring running through the failure of a single server, on your own site, without waiting for a replacement to ship.
Normal operation
Server 1 is the primary. It runs the DM and handles all monitoring. Users and equipment reach it over your network through Interface 0.
Replication
While Server 1 runs, the DM virtual machine is continuously replicated to Server 2 over Interface 1 and the dedicated switch. This traffic stays off your network.
If the primary fails
The standby copy on Server 2 is brought online and monitoring continues. Server 2 has its own connection to your network. Once Server 1 is repaired, the DM moves back.
DM servers: Standard and Enterprise.
Both run identical DM software. Choose by the size of the fleet and the resilience the site needs.


| MSS — DM StandardMSS-DM · redundant kit MSS-DM-RK | MSE — DM EnterpriseMSE-DM · redundant kit MSE-DM-RK | |
|---|---|---|
| Built for | A single site or a modest fleet | Larger fleets, and sites that require redundancy |
| Form factor | 1U short-depth rack mount; cabled from the rear | 1U rack mount; front access, cabled from the front |
| Power | Single power supply | Dual redundant, hot-swap power supplies |
| Storage | Single data drive | Dual mirrored data drives plus a separate boot drive |
| Network | Dual 1 GbE, plus dedicated IPMI port | Dual 10 GbE, plus dedicated IPMI port |
| Polling | Standard parallelism | Around double the parallelism of Standard |
| Trend history | Limited by database size | Unlimited, retained at full resolution |
| Redundant pair | Available, with cross-server replication | Available, with cross-server replication |
Specifications describe each server's capability class. Components may be substituted with parts of equal or greater capability. Server hardware carries the manufacturer's own warranty.
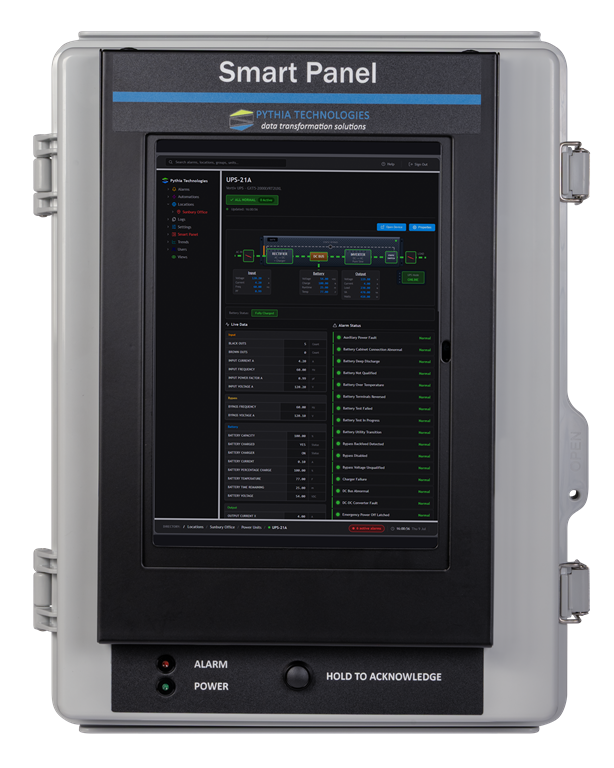
A Smart Panel is a DM.
It runs the same software as a DM server, built into a wall- or panel-mounted enclosure. It is not a gateway or a device that reports to a server. Mechanical rooms, electrical rooms and closets without a rack take a panel. Everything on this page applies: console, alarms, notifications, trends, dashboards, publishing and the AI Connector.
Smart Panel DM
- Eight onboard inputs, each a dry contact or a thermistor. Common local points need no extra I/O module.
- With an integrated display (SPDM) or without (SPDM-ND). Both are functionally identical.
- Monitors older serial equipment on the wiring already in place.
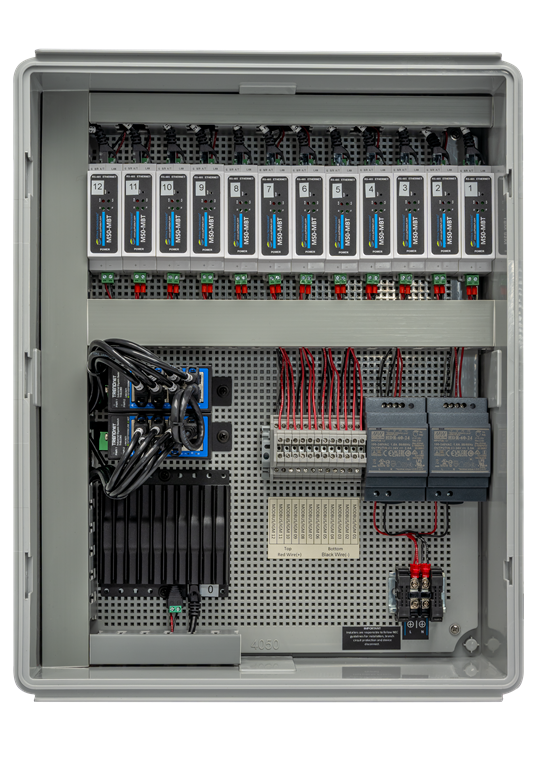
Smart Panel IGM
- Built for Liebert equipment with IGM interfaces.
- Connects up to 12 IGM devices over the existing RS-422 wiring. No rewiring.
- A drop-in replacement for Liebert SiteLink.
- Built-in Ethernet switch, so one network connection serves the panel.
- Liebert cooling, UPS, power and leak-detection units get equipment dashboards.
The Smart Panel AC4 (SPAC4) automatic changeover panel is covered on its own page.
Ask your site a question. Get an answer from live data.
Connect Claude, ChatGPT or any assistant that speaks MCP or HTTPS. It reads what your operators see: live values, alarms and history, controls, trends and the DM's protocol maps. Ask "Is anything in alarm right now?" or "Chart the UPS load for the last week" and the answer comes from the site itself. When you allow it, the assistant can make a few tightly limited changes, such as changing an enabled control's setpoint or acknowledging an alarm.
From order to handover, and after.
- Deployment: turn-up and unit commissioning, remote or on site.
- Custom graphic pages: floor plans, heat maps and one-lines, built to order from your drawings.
- Software Assurance: priority support, automatic DM upgrades and device template updates, automatic encrypted configuration backups and a block of remote engineering hours. Sites that prefer to manage their own can opt out of the automatic backups and updates.
- Warranty: one year standard, with extended hardware warranty available.
Facilities, IT and the teams adopting AI.
- IT and OT teams: building infrastructure under a management model IT recognizes: centrally monitored, HTTPS throughout, kept current by a vendor accountable for it.
- Facilities managers: real-time visibility and alerting across every connected system, without becoming an IT specialist to get it.
- Teams adopting AI: a reliable, structured feed of operational data from physical infrastructure, read-only until you decide otherwise.
Pythia DM questions, answered.
What is the Pythia DM?
The Pythia DM is a facility monitoring platform for the power, cooling and environmental equipment that keeps a site running. It polls each piece of equipment in its own protocol and shows everything live in one browser console, with alarms, notifications, trends and equipment dashboards. It also publishes the same data to your BMS, SCADA or NMS.
What equipment can the DM monitor?
UPS systems and batteries, generators and transfer switches, CRAC units, chillers and pumps, power distribution and meters, leak and environmental sensors, and servers and network switches. Supported UPS, cooling, power, generator, server and switch models open a live equipment dashboard as soon as they are added. Drivers for other equipment are supplied on request.
Which protocols does the DM support?
The DM talks to equipment over BACnet/IP, Modbus/TCP, Modbus RTU, SNMP, HTTP, XML and Liebert IGM, with drivers for other equipment supplied on request. It publishes everything it monitors as an SNMP v1/v2c agent, a Modbus/TCP server and a BACnet/IP device, and sends email and SNMP trap notifications.
Can the DM send its data to my building management system?
Yes. Every point the DM monitors is published at once as a BACnet/IP device, a Modbus/TCP server and an SNMP agent. The point maps are built and kept current automatically, so your BMS or NMS reads the same data your operators see.
Do I need to install software to use the DM?
No. The DM console runs in a standard web browser on a PC, tablet or phone over HTTPS. Nothing is installed on operator PCs.
How is the DM deployed?
The same DM software runs four ways: on a 1U rack server (Standard MSS or Enterprise MSE), on a redundant pair of servers with continuous replication, in a wall-mounted Smart Panel (SPDM, SPDM-ND or SPIGM), or as DM Cloud, a dedicated VM identical to a purchased server, hosted by Pythia in Microsoft Azure.
What happens if the DM server fails?
With the redundant pair, the DM virtual machine is continuously replicated from the primary server to a standby server over a dedicated switch. If the primary fails, the standby copy is brought online and monitoring continues.
Can one DM monitor many sites?
Yes. A head-end DM consolidates many site DMs into one view, and DMs can also be arranged peer to peer.
Can the DM replace Liebert SiteLink or monitor Liebert IGM equipment?
Yes. The Smart Panel IGM (SPIGM) is a DM built for Liebert equipment with IGM interfaces. It connects up to 12 IGM devices over the existing RS-422 wiring and is a drop-in replacement for Liebert SiteLink.
Can AI assistants like Claude or ChatGPT use DM data?
Yes, with the DM AI Connector. An assistant that speaks MCP or HTTPS can read live values, alarms, history, controls and trends. New assistant accounts are read-only, every write policy is off until an administrator turns it on, and credentials are never visible to the assistant. The AI Connector is available for the DM server, SPDM, SPIGM and SPAC4.
See the DM running on equipment like yours.
Ask for a demo, or tell us how many pieces of equipment you need to watch and we'll size the platform for you.
Request a demo740.363.2272
sales@pythiatech.com
7540 Sawmill Parkway, Suite E, Powell, Ohio 43065